
This application note is Part 3 in a series from Gamry Instruments.
Part 1 of this series discusses basic principles of dye solar cells, their setup, and underlying electrochemical mechanisms.
Part 2 addresses electrochemical impedance spectroscopy measurements on dye solar cells. Various models are discussed for analyzing impedance spectra.
Part 3 addresses IMPS and IMVS experiments on dye solar cells. Theory and implementation of both techniques are explained. Data evaluation is discussed based on experiments.
Introduction
Intensity‑modulated photocurrent spectroscopy (IMPS) and intensity‑modulated photovoltage spectroscopy (IMVS) can offer valuable information about dye solar cells (DSCs). IMPS and IMVS yield time constants which are related to the electron transport and electron recombination. Both parameters can be used to calculate the diffusion coefficient and the diffusion length, among others.
Basic principles
IMPS and IMVS are related to electrochemical impedance spectroscopy (EIS). In EIS, a constant potential or current signal is applied to a cell which is superimposed by an AC signal. The frequency is modulated. The measured sinusoidal signal has the same frequency as the applied signal but it is phase‑shifted. The frequency‑dependent impedance Z can be then calculated.
Both IMPS and IMVS operate in a similar way. Instead of modulating the amplitude of a current or potential signal, the intensity of a light beam focused on a DSC is modulated. Figure 1 illustrates both techniques.
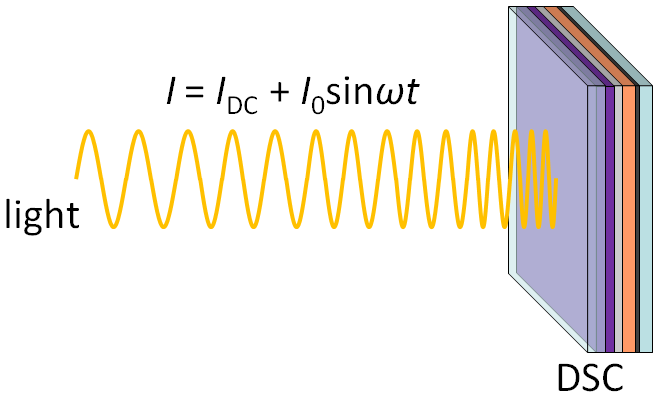
Figure 1. Sketch of the light signal focused on a DSC during IMPS and IMVS.
During IMPS and IMVS experiments, light with a base intensity IDC is focused on a DSC. Upon the constant base intensity, a sinusoidal waveform with amplitude I0 is superimposed. The frequency f of the sine wave is changed during an experiment. The angular frequency w can be expressed as w = 2pf. The photocurrent (IMPS) or photovoltage (IMVS) respectively of a DSC is measured. Similar to EIS – but in this case light – the resultant signal has the same frequency as the applied signal, but its phase is shifted. By changing the frequency of the light signal, time‑dependent information about various processes such as diffusion coefficients or reaction rates can be obtained.
EIS and IMPS/IMVS can be further differentiated by looking at the I‑V curve of a DSC. Figure 2 shows stylized sketches of I‑V curves with increasing light intensity. The regions covered by EIS, IMPS, and IMVS are highlighted.
The power generated by a DSC rises with increasing light intensity. As a result, the photocurrent increases leading to a higher short‑circuit current ISC at 0 V. In addition, the open‑circuit potential EOC shifts towards higher potentials, too.
Typically, experiments with DSCs are performed under constant illumination. When measuring EIS spectra, only one point of a single I‑V curve can be analyzed. In contrast, the light intensity is modulated during IMPS and IMVS. This way, the cell’s response within a series of I‑V curves can be measured. The regions for IMPS and IMVS are highlighted in green and red in Figure 2.

Figure 2. I V curves of a DSC showing the regions covered by EIS, IMPS, and IMVS.
Read the complete application note and data analysis if IMPS/IMVS Measurements at Gamry.com.