This application note is part 2 in a series on Dye Solar Cells from Gamry Instruments.
Purpose of This Note
This application note is part of a series concerning dye solar cells. Theory and various types of experiments are discussed which are helpful for characterizing solar cells.
Part 1 of this dye solar cell series discusses basic principles of dye solar cells, their setup, and underlying electrochemical mechanisms.
This application note is part 2 and deals with electrochemical impedance spectroscopy (EIS) measurements on dye solar cells. The effect of various parameters is shown by means of experiments. Different EIS models are discussed which can be used to analyze impedance spectra.
Theory
Impedance spectroscopy with dye solar cells
As discussed in Part 1, various electrochemical processes take place in a dye solar cell (DSC). By measuring the I‑V curves, many important parameters such as short‑circuit current ISC, open‑circuit potential (EOC), Fill factor FF, or cell efficiency h can be determined.
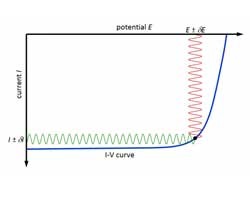
EIS offers additional information about various parameters of a DSC. When performing an EIS experiment, a specific point of an I‑V curve can be analyzed (see also Figure 1).
In this experiment, a DC‑signal is applied to the cell which is superimposed by a small AC‑signal (E ± dE). The frequency of the sinusoidal signal is changed during the experiment and the current response of the cell is measured (I ± dI). The sinusoidal signal has the same frequency as the applied signal but its phase is shifted. Both E and I are used to calculate the frequency‑dependent impedance Z of the cell.
For detailed analysis, EIS models can be used to fit the measured curves. The next sections discuss various EIS experiments on DSCs and their analysis.
**For more information on the theory of electrochemical impedance spectroscopy, see Gamry’s application note: Basics of Electrochemical Impedance Spectroscopy.
For Experiments and to download a PDF version, visit Gamry Instruments Dye Solar Cells – Part 2: Impedance Measurements

