Potentiostats for Battery Research Testing

Potentiostats for Battery Research Testing

Take two different metals, place an ion transporting medium between them, wire them up to be connected outside the electrolyte solution (perhaps to a voltmeter or potentiostat) and you’ve made a battery. With the ever-increasing demand for portable power, batteries are becoming more and more important. As demands on battery performance increase, so do demands Read more about Potentiostats for Battery Research Testing[…]

Favorite Electrochemistry EIS Books Availalbe

Selecting a Reference Electrode

My favorite My favorite reference electrode is the Ag/AgCl reference.electrode. Due to its simplicity, it is quite robust, and can be easily and effectively ‘revived’ if it should dry out. Moderately high temperatures ( 100 °C ) can be tolerated, as long as the AgCl does not completely dissolve and the construction materials are suitably Read more about Selecting a Reference Electrode[…]

Center for Electrochemical Engineering Research

Ohio University Receives Electrochemical Engineering Grant

Ohio University Electrochemical Engineering Research Center Receives $379,000 NIST Grant .S. Department of Commerce and National Institute of Standards and Technology (NIST). The award will be used to establish a consortium to support, sustain, and enhance U.S. manufacturing capacity in the nation’s chemical industry and allied sectors through innovative electrochemical processes. Under the Advanced Manufacturing Read more about Ohio University Receives Electrochemical Engineering Grant[…]

equation for a Warburg's impedance

Fitting EIS Data – Diffusion Elements

Whenever you look at a Complex-Plane Impedance Plot ( Nyquist or Cole-Cole plot) and see a 45° line, or fit data to an equivalent circuit and find a Constant Phase Element (CPE) with an n-value close to 0.5, you should consider diffusion as a possible explanation.

Diffusion Circuit Elements – Warburg

The most common diffusion circuit is the so-called “Warburg” diffusion element, but it is not the only one! A Warburg impedance element can be used to model semi-infinite linear diffusion, that is, unrestricted diffusion to a large planar electrode. This is the simplest diffusion situation because it is only the linear distance from the electrode that matters.
The Warburg impedance is an example of a constant phase element for which the phase angle is a constant 45° and independent of frequency. The magnitude of the Warburg impedance is inversely proportional to the square root of the frequency
as you would expect for a CPE with an n-value of 0.5. The Warburg is unique among CPE’s because the real and imaginary components are equal at all frequencies and both depend upon warburg-equations - 1
[…]

Reference Electrode for Ionic Liquids

Reference Electrode for Ionic Liquids

Room temperature ionic liquids or simply ionic liquids (some even call them molten salts) can act as a great solvent for electrochemistry but they bring along a challenge of what to use for the reference electrode. Traditional saturated calomel or Ag/AgCl reference electrodes use water as a solvent which can cause trouble for ionic liquids. Read more about Reference Electrode for Ionic Liquids[…]

CPE in parallel with a resistance

The Constant Phase Element (CPE)

What is a Constant Phase Element?

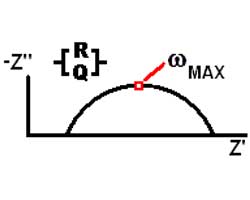
The Constant Phase Element (CPE) is a non-intuitive circuit element that was discovered (or invented) while looking at the response of real-world systems. In some systems the Nyquist plot (also called the Cole-Cole plot or Complex Impedance Plane plot) was expected to be a semicircle with the center on the x-axis. However, the observed plot was indeed the arc of a circle, but with the center some distance below the x-axis.
These depressed semicircles have been explained by a number of phenomena, depending on the nature of the system being investigated. However, the common thread among these explanations is that some property of the system is not homogeneous or that there is some distribution (dispersion) of the value of some physical property of the system.

CPE equations

Mathematically, a CPE’s impedance is given by

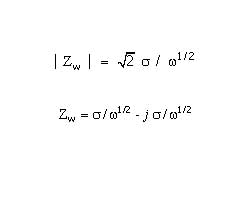
1 / Z = Y = Q° ( j omega )n

where Q° has the numerical value of the admittance (1/ |Z|) at omega =1 rad/s. The units of Q° are S•sn (ref 1).
A consequence of this simple equation is that the phase angle of the CPE impedance is independent of the frequency and has a value of -(90*n) degrees. This gives the CPE its name.

When n=1, this is the same equation as that for the impedance of a capacitor, where Q° =C.

1 / Z = Y = j omega Q° = j omega C

When n is close to 1.0, the CPE resembles a capacitor, but the phase angle is not 90°. It is constant and somewhat less than 90° at all frequencies. In some cases, the ‘true’ capacitance can be calculated from Q° and n
The Nyquist (Complex Impedance Plane) Plot of a CPE is a simple one. For a solitary CPE (symbolized here by Q), it is just a straight line which makes an angle of (n*90°) with the x-axis as shown in pink in the Figure. The plot for a resistor (symbolized by R) in parallel with a CPE is shown in green. In this case the center of the semicircle is depressed by an angle of (1-n)*90°

What Causes a CPE?

[…]

The Working electrode is not at Virtual Ground

Potentiostat Architectures – Passive I/E Converters

A Common Potentiostat Design

This style of I/E Converter is well suited to potentiostats with output currents of a few tenths of an ampere up to several A Common Potentiostat Design
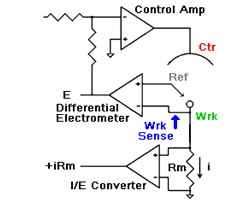
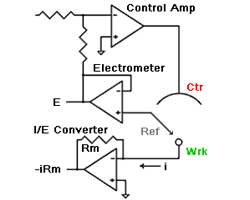
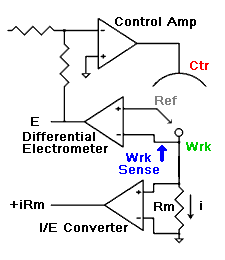
amperes. This scheme has been used by Gamry, PAR, Solartron, and perhaps others.

The I/E Converter is a “passive” design

The current path through the I/E converter only traverses passive components such as wires and resistors. No active components (such as op amps or transistors) are in the current path. The current measurement resistor is connected between the Working electrode and the potentiostat’s power supply ground (or “current return”).

The Working electrode is not at Virtual Ground

This is a consequence of the passive design. The working electrode voltage (vs the potentiostat’s internal ground) depends on the current flowing. In the sketch shown to the right, the working electrode will be at (i*Rm) volts. The actual voltage may be higher due to the resistance of the cell cable connecting the potentiostat to the working electrode!

Potentiostat with differential electrometer

[…]

Even if the I/E circuit is not overloaded, it can have severe influence on potentiostat stability.

Potentiostat Architectures – Active I/E Converters

The Classical Potentiostat The schematic at the right is the classical potentiostat design shown in nearly every modern electrochemistry textbook. It has three basic features. The Working electrode is at Virtual Ground. The working electrode is at the same potential as the potentiostat’s electronic ground. This ground is often connected to Earth Ground. The electrometer Read more about Potentiostat Architectures – Active I/E Converters[…]

References on Corrosion Theory and Electrochemical Corrosion Tests

Many of the following ‘references’ are available at Amazon.com and can be viewed at our Bookstore. DC Electrochemical Test Methods, N.G. Thompson and J.H. Payer, National Association of Corrosion Engineers, 1440 South Creek Drive, Houston, TX 77084-4906. Phone: 281-228-6200. Fax: 281-228-6300. ISBN: 1-877914-63-0. Recommended! Principles and Prevention of Corrosion, Denny A. Jones, Prentice-Hall, Upper Saddle Read more about References on Corrosion Theory and Electrochemical Corrosion Tests[…]

Electrochemical Quantitative Corrosion Theory

Quantitative Corrosion Theory

In the previous post (Electrochemical Corrosion Measurements Primer) we pointed out that Icorr cannot be measured directly. In many cases, you can estimate it from current versus voltage data. You can measure a log current versus potential curve over a range of about one half volt. The voltage scan is centered on Eoc. You then fit the measured data to a theoretical model of the corrosion process.

The model we will use for the corrosion process assumes that the rates of both the anodic and cathodic processes are controlled by the kinetics of the electron transfer reaction at the metal surface. This is generally the case for corrosion reactions. An electrochemical reaction under kinetic control obeys Equation 1-1, the Tafel Equation.

the Tafel Equation

Equation 1-1

[…]

Electrochemical Corrosion Measurements

Electrochemical Corrosion Measurements Primer

Most metal corrosion occurs via electrochemical reactions at the interface between the metal and an electrolyte solution. A thin film of moisture on a metal surface forms the electrolyte for atmospheric corrosion. Wet concrete is the electrolyte for reinforcing rod corrosion in bridges. Although most corrosion takes place in water, corrosion in non-aqueous systems is not unknown.

Corrosion normally occurs at a rate determined by an equilibrium between opposing electrochemical reactions. The first is the anodic reaction, in which a metal is oxidized, releasing electrons into the metal. The other is the cathodic reaction, in which a solution species (often O2 or H+) is reduced, removing electrons from the metal. When these two reactions are in equilibrium, the flow of electrons from each reaction is balanced, and no net electron flow (electrical current) occurs. The two reactions can take place on one metal or on two dissimilar metals (or metal sites) that are electrically connected.

Basics of electrochemical corrosion measurement

Figure 1-1. Corrosion Process Showing Anodic and Cathodic Current Components.

Figure 1-1 diagrams this process. The vertical axis is potential and the horizontal axis is the logarithm of absolute current. The theoretical current for the anodic and cathodic reactions are shown as straight lines. The curved line is the total current — the sum of the anodic and cathodic currents. This is the current that you measure when you sweep the potential of the metal with your potentiostat. The sharp point in the curve is actually the point where the current changes signs as the reaction changes from anodic to cathodic, or vice versa. The sharp point is due to the use of a logarithmic axis. The use of a log axis is necessary because of the wide range of current values that must be displayed during a corrosion experiment. Because of the phenomenon of passivity, it is not uncommon for the current to change by six orders of magnitude during a corrosion experiment.

[…]

This website uses cookies to ensure you get the best experience on our website. More information

The cookie settings on this website are set to "allow cookies" to give you the best browsing experience possible. If you continue to use this website without changing your cookie settings or you click "Accept" below then you are consenting to this. Please review our Privacy Policy

Close